Unpacking regressions
Linear regression (OLS):
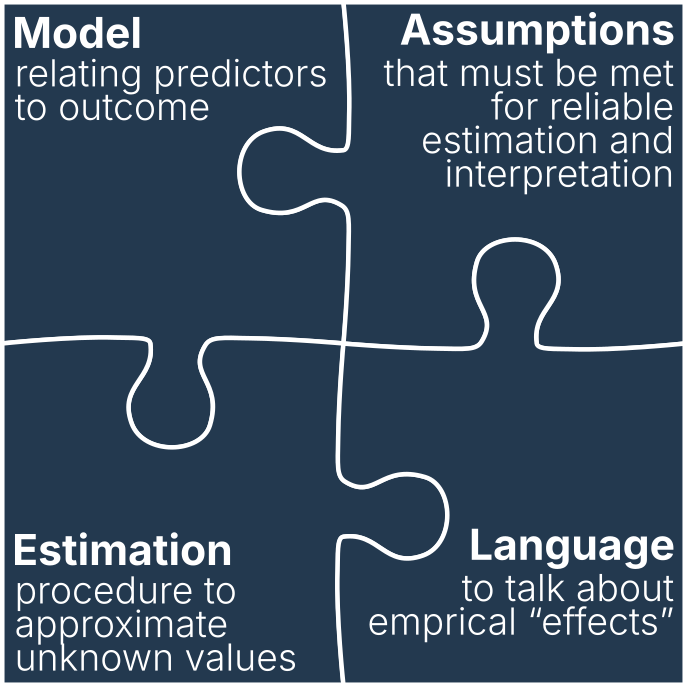
Unpacking regressions
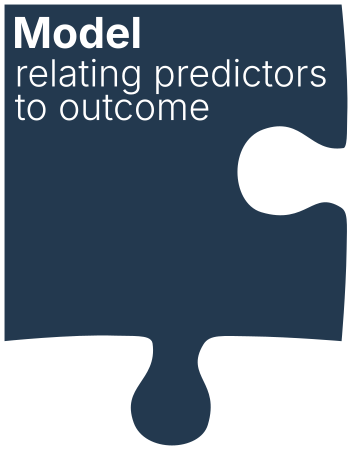
- As social scientists, the model is what we really care about
A ‘mental map’ of your theoretical argument - Also the fun part
Building a tiny working model of the social world - OLS (like all models) comes with very specific ideas about what can matter in the social world and how those things can be related
Abbott (1988):Transcending general linear reality
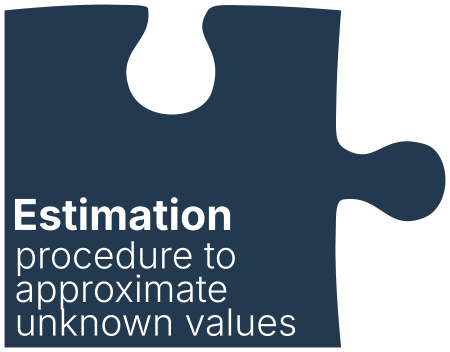
- Predictions and measures from model and data
- Technical procedures
Important, but less sociological - Ordinary least squares (OLS)
- But also: maximum likelinhood (ML); maximum a-posteriori (MAP); Markov chain Monte-Carlo (MCMC); …
Probability models
We will use the lens of probability models to describe all of the models in the class.
Intuitive
- Probability distributions help to break models into components
- Probability distributions provide an intuitive language for discussing uncertainty
Flexible
- Probability distributions describe the uncertainties in the social processes you are studying
- Simple algebra fits these distributions together to make a model that supports your claims
Bayesian vs. frequentist statistics
Probability models are often associated with “Bayesian” statistics, which itself is often contrasted with “Frequentist” statistics. What do those terms mean?
Frequentist
Bayesian
Philosophical contrasts
- The probability of an event is the proportional frequency of that event across the entirety of a given ‘context’
- The probability of an event is is a rigorous way to quantify subjective uncertainty about that event
Practical contrasts
- Significant limitations on types of models that can be used
- Fast computation of estimates for those models (OLS, ML, …)
- Diffcult to talk about level of confidence in estimates
- Easy to work with a wide range of models
- Estimation is computationally “expensive” (MCMC, Hamiltonian MC, …)
- (Arguably) easy to talk about confidence in estimates
- Need to specify prior beliefs (more on this later)
In practice, these differences usually remain “under the hood.” Either approach can be used with no significant impact on reliability or credibility.
I strongly advocate for a pragmatic approach: use whichever framing makes the most sense for your specific model, data, resources, and audience.
Roadmap

Roadmap
Part 1: Parametric probability models
- Social-scientific models as random processes
- Overview of probability distributions
- Estimating parameters
Part 2: Linear models and model checking
- Re-framing linear regression as probability model
- General model considerations (causality, overfitting)
Part 3: Generalized linear models
- Expanding linear models with outcome distributions and link functions
- Binary, count, and categorical outcomes
Part 4: Complications in data and estimation
- Missing data and weighted observations
Part 5: Multilevel models
- Two-level models (nested data)
- Covariance structures
- Generalized multilevel models
Part 6: Building more complex models
- Probability models for other processes
Logistics

Schedule
Syllabus
- https://soci620.netlify.app
- Updated regularly with links to assignments and slides and changes to the schedule
Class periods
- Lecture and discussion
Formal discussion of topics - Usually finish with demos
Working in R - Laptop will be necessary
Labs
- Work through example code with TA
- Work on assignments/projects in the same space as one another (study hall)
Ask questions, consult, commiserate - Once per week
Assessments
Worksheets
- Five worksheets over the semester
Due dates on syllabus - Distributed as RMarkdown templates to complete
- Everyone will evaluate two of their peers for each worksheet using FeedbackFruits
- Turn in through MyCourses
- Working together is fine (encouraged, even!), but each person needs to create their own writeup of code and expproseosition
Research project
- The main item is an original research project
- Due in four parts (the four "P"s):
Precis; proposal; presentation; paper - Ideally, will be part of a larger research project
E.g. a draft of the methods section for a dissertation chapter? - Meet with me early in the semester to discuss your topic ideas
Generative AI

“Generative AI”
- Language models that predict subsequent “tokens” based on previous text.
- E.g. Microsoft Copilot (provided by McGill) OpenAI’s ChatGPT, Google’s Gemini, Meta’s Llama, etc.
The use of these tools is strongly discouraged
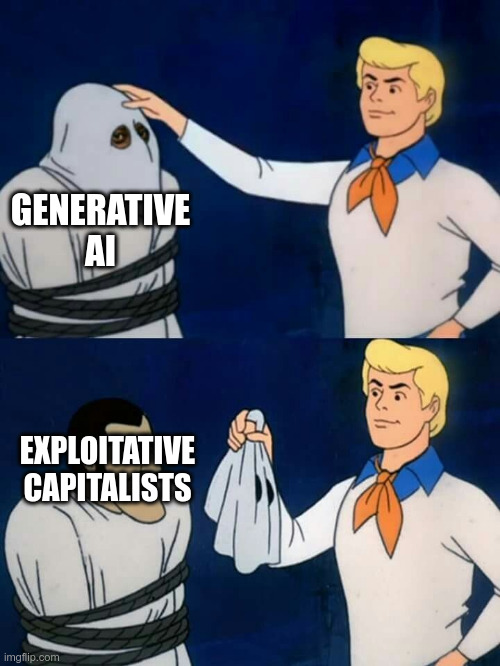
- They are bad for the world.
- They are bad for students.
Generative AI is bad for the world
Environmental impact
- Generative AI uses huge amounts electricity and water to train and to use
“Just Five ChatGPT Queries Can Use 16oz of Water, Say Researchers” - Generative AI contributes significantly to climate change
“Google emissions jump nearly 50% over five years as AI use surges”

Human exploitation
- Generative AI relies on underpaid humans to label (often harmful) content
“What’s behind the AI boom? Exploited humans” - Generative AI is build on countless humans’ uncredited, uncompensated creative work
Generative AI is bad for students
“Typical” text
- The technology that makes generative AI work is essentially like the predictive text on your phone, but trained on as much of the internet as corporations can get their hands on.
One thousand Redditors (or Github projects) in a trenchcoat - The models are trained solely to sound unsurprising, not to recognize important or interesting ideas.
“When ChatGPT summarises, it actually does nothing of the kind”
Writing is its own end
- Struggling with composition is useful—that is where the thinking (and learning) happens
“We can also save time by undercooking fish, but it’s not ideal.” — Eryk Salvaggio - Using AI to write your code will hinder your learning
- AI-generated code contains frequent mistakes that can be hard even for experts to spot
- You are here to learn, and coding with AI will hinder that learning

Tools & resources
Microsoft Teams
- Available at this link through browser or app
- Q&A and discussions (ask and answer!)
- Best place to contact me
- Let me know if you have trouble with access
MyCourses
- Turning in assignments
- FeedbackFruits for peer assessment
Readings
- Richard McElreath’s Statistical Rethinking, (Second Edition)
Online access through library
Software
The R language
- Class, labs, and worksheets will use R
- Open source (free forever)
- Vibrant ecosystem of add-on packages
- De facto standard for scholarly statistics
RMarkdown
- Plain-text format to incorporate R code into documents
- Converts to Word, PDF, HTML, …
- (Quarto is very similar to RMarkdown)
RStudio (optional)
- A convenient interface to R and RMarkdown
- Made by Posit, the “opinionated” company behind
tidyverse - Alternatives:
VSCode (VSCodium) from Microsoft;
or any text editor and terminal
RStudio (or VSCode)
User-friendly interface to
the R environment and
RMarkdown
R
Statistical language and
environment (the ‘engine’
of your analysis)
rethinking
brms
R package for Bayesian model estimation
lme4
R package for mulilevel GLM estimation
…
Other R packagages (tidyverse, data.table, ggplot, …)
stan
General-purpose software for MCMC estimation
Software
Installing
- Detailed instructions to install necessary software are available at:
https://soci620.netlify.app/pages/software.html
Testing
-
A simple script to test the
rethinkinginstallation is at:
https://soci620.netlify.app/labs/lab_1.R -
You can download and run this, copy and paste it, or run the whole thing from directly in R:
source("https://soci620.netlify.app/labs/lab_1.R")
Image credit

Photo by Marlis Trio Akbar on Unsplash
Photo by John Hritz on Flickr

Playmatey magnetic building blocks via WorthPoint

Coloured engraving by S.J. Neele after L. Hebert. Wellcome Collection.

Photo by Natasha Wheatland on Flickr

Photo by Wikimedia user Etan J. Tal

Photo by Patrick Hendry on Unsplash

Faces of 500 professional golfers, averaged by Reddit user u/osmutiar/