Interpreting coefficients
Predicting ridership using temperature
| Post. mean | |
|---|---|
|
|
878.28 |
|
|
90.96 |
Units of temperature:
Degrees celsius
Units of ridership:
Number of riders
Interpretation of
For every increase of one degree celsius, the model predicts an average of 90.96 more riders per day at each bike counter
Standardized variables
Predicting St(ridership) using St(temperature)
| Post. mean | |
|---|---|
|
|
0.0 |
|
|
0.644 |
Units of temperature:
Standard deviations of temperature
Units of ridership:
Standard deviations of ridership
Interpretation of
For every increase of one standard deviation of temperature, the model predicts an average of 0.644 more standard deviations of ridership per day at each bike counter
Log of outcome variable
Predicting Log(ridership) using temperature
| Post. mean | Exp(mean) | |
|---|---|---|
|
|
6.12 | 454.47 |
|
|
0.085 | 1.089 |
If the temperature changes from
Log of outcome variable
Log of outcome variable
Predicting Log(ridership) using temperature
| Post. mean | Exp(mean) | |
|---|---|---|
|
|
6.12 | 454.47 |
|
|
0.085 | 1.089 |
Units of temperature:
Degrees celsius
Units of ridership:
Log ridership
Interpretation of
For every increase of one degree celsius, the model predicts an average increase of 8.9% in ridership per day at each bike counter
Prior and posterior predictive plots

Prior predictive plot
Prior predictive plots allow you to visualize the implications of a set of priors
Prior predictive plot
|
|
|
|---|---|
| 12.45 | 2.58 |
Prior predictive plot
|
|
|
|---|---|
| 12.45 | 2.58 |
| 8.01 | 0.51 |
Prior predictive plot
|
|
|
|---|---|
| 12.45 | 2.58 |
| 8.01 | 0.51 |
| 12.55 | 1.42 |
Prior predictive plot
|
|
|
|---|---|
| 12.45 | 2.58 |
| 8.01 | 0.51 |
| 12.55 | 1.42 |
| 8.01 | -3.34 |
Prior predictive plot
|
|
|
|---|---|
| 12.45 | 2.58 |
| 8.01 | 0.51 |
| 12.55 | 1.42 |
| 8.01 | -3.34 |
| 18.19 | 3.85 |
Prior predictive plot
|
|
|
|---|---|
| 12.45 | 2.58 |
| 8.01 | 0.51 |
| 12.55 | 1.42 |
| 8.01 | -3.34 |
| 18.19 | 3.85 |
| 13.11 | 3.24 |
| 11.01 | 0.66 |
| 15.54 | 1.36 |
| 8.97 | -4.10 |
| 8.11 | -0.42 |
| 8.48 | 3.76 |
| ︙ | ︙ |
Visualizing predictions
To better illustrate uncertainty in posterior estimates, we will use a random subsample of 400 counter–days.
Visualizing predictions
| Post. median | 80% post. interval | |
|---|---|---|
|
|
6.877 | (6.823, 6.931) |
|
|
0.940 | (0.887, 0.996) |
|
|
0.841 | (0.804, 0.981) |
Posterior distribution of mean:
- Take a sample of size
- For each value of standardized temperature
- Calculate quantiles (say, 10% and 90%) of the posterior draws
Visualizing predictions
| Post. median | 80% post. interval | |
|---|---|---|
|
|
6.877 | (6.823, 6.931) |
|
|
0.940 | (0.887, 0.996) |
|
|
0.841 | (0.804, 0.981) |
Posterior predictive distribution:
- Take a sample of size
- For each value of standardized temperature
- For each of the
- Calculate quantiles (say, 10% and 90%) of the posterior draws
Posterior mean vs. predicted
For any given mean temperature,
The posterior distribution of
This distribution takes into account the model coefficients
The 80% posterior interval of
For any given mean temperature, the posterior predictive distribution describes the range of riderships we would expect for any day with that temperature.
The posterior predictive distribution describes our uncertainty about the value of
This distribution takes into account all the model parameters:
The 80% posterior predictive interval should contain about 80% of the data, and should not get appreciably narrower as more data is added.
Posterior mean vs. predicted
Image credit
Figures by Peter McMahan (source code)

Alfred Hitchcock in Funhouse Mirror by Globe Photos

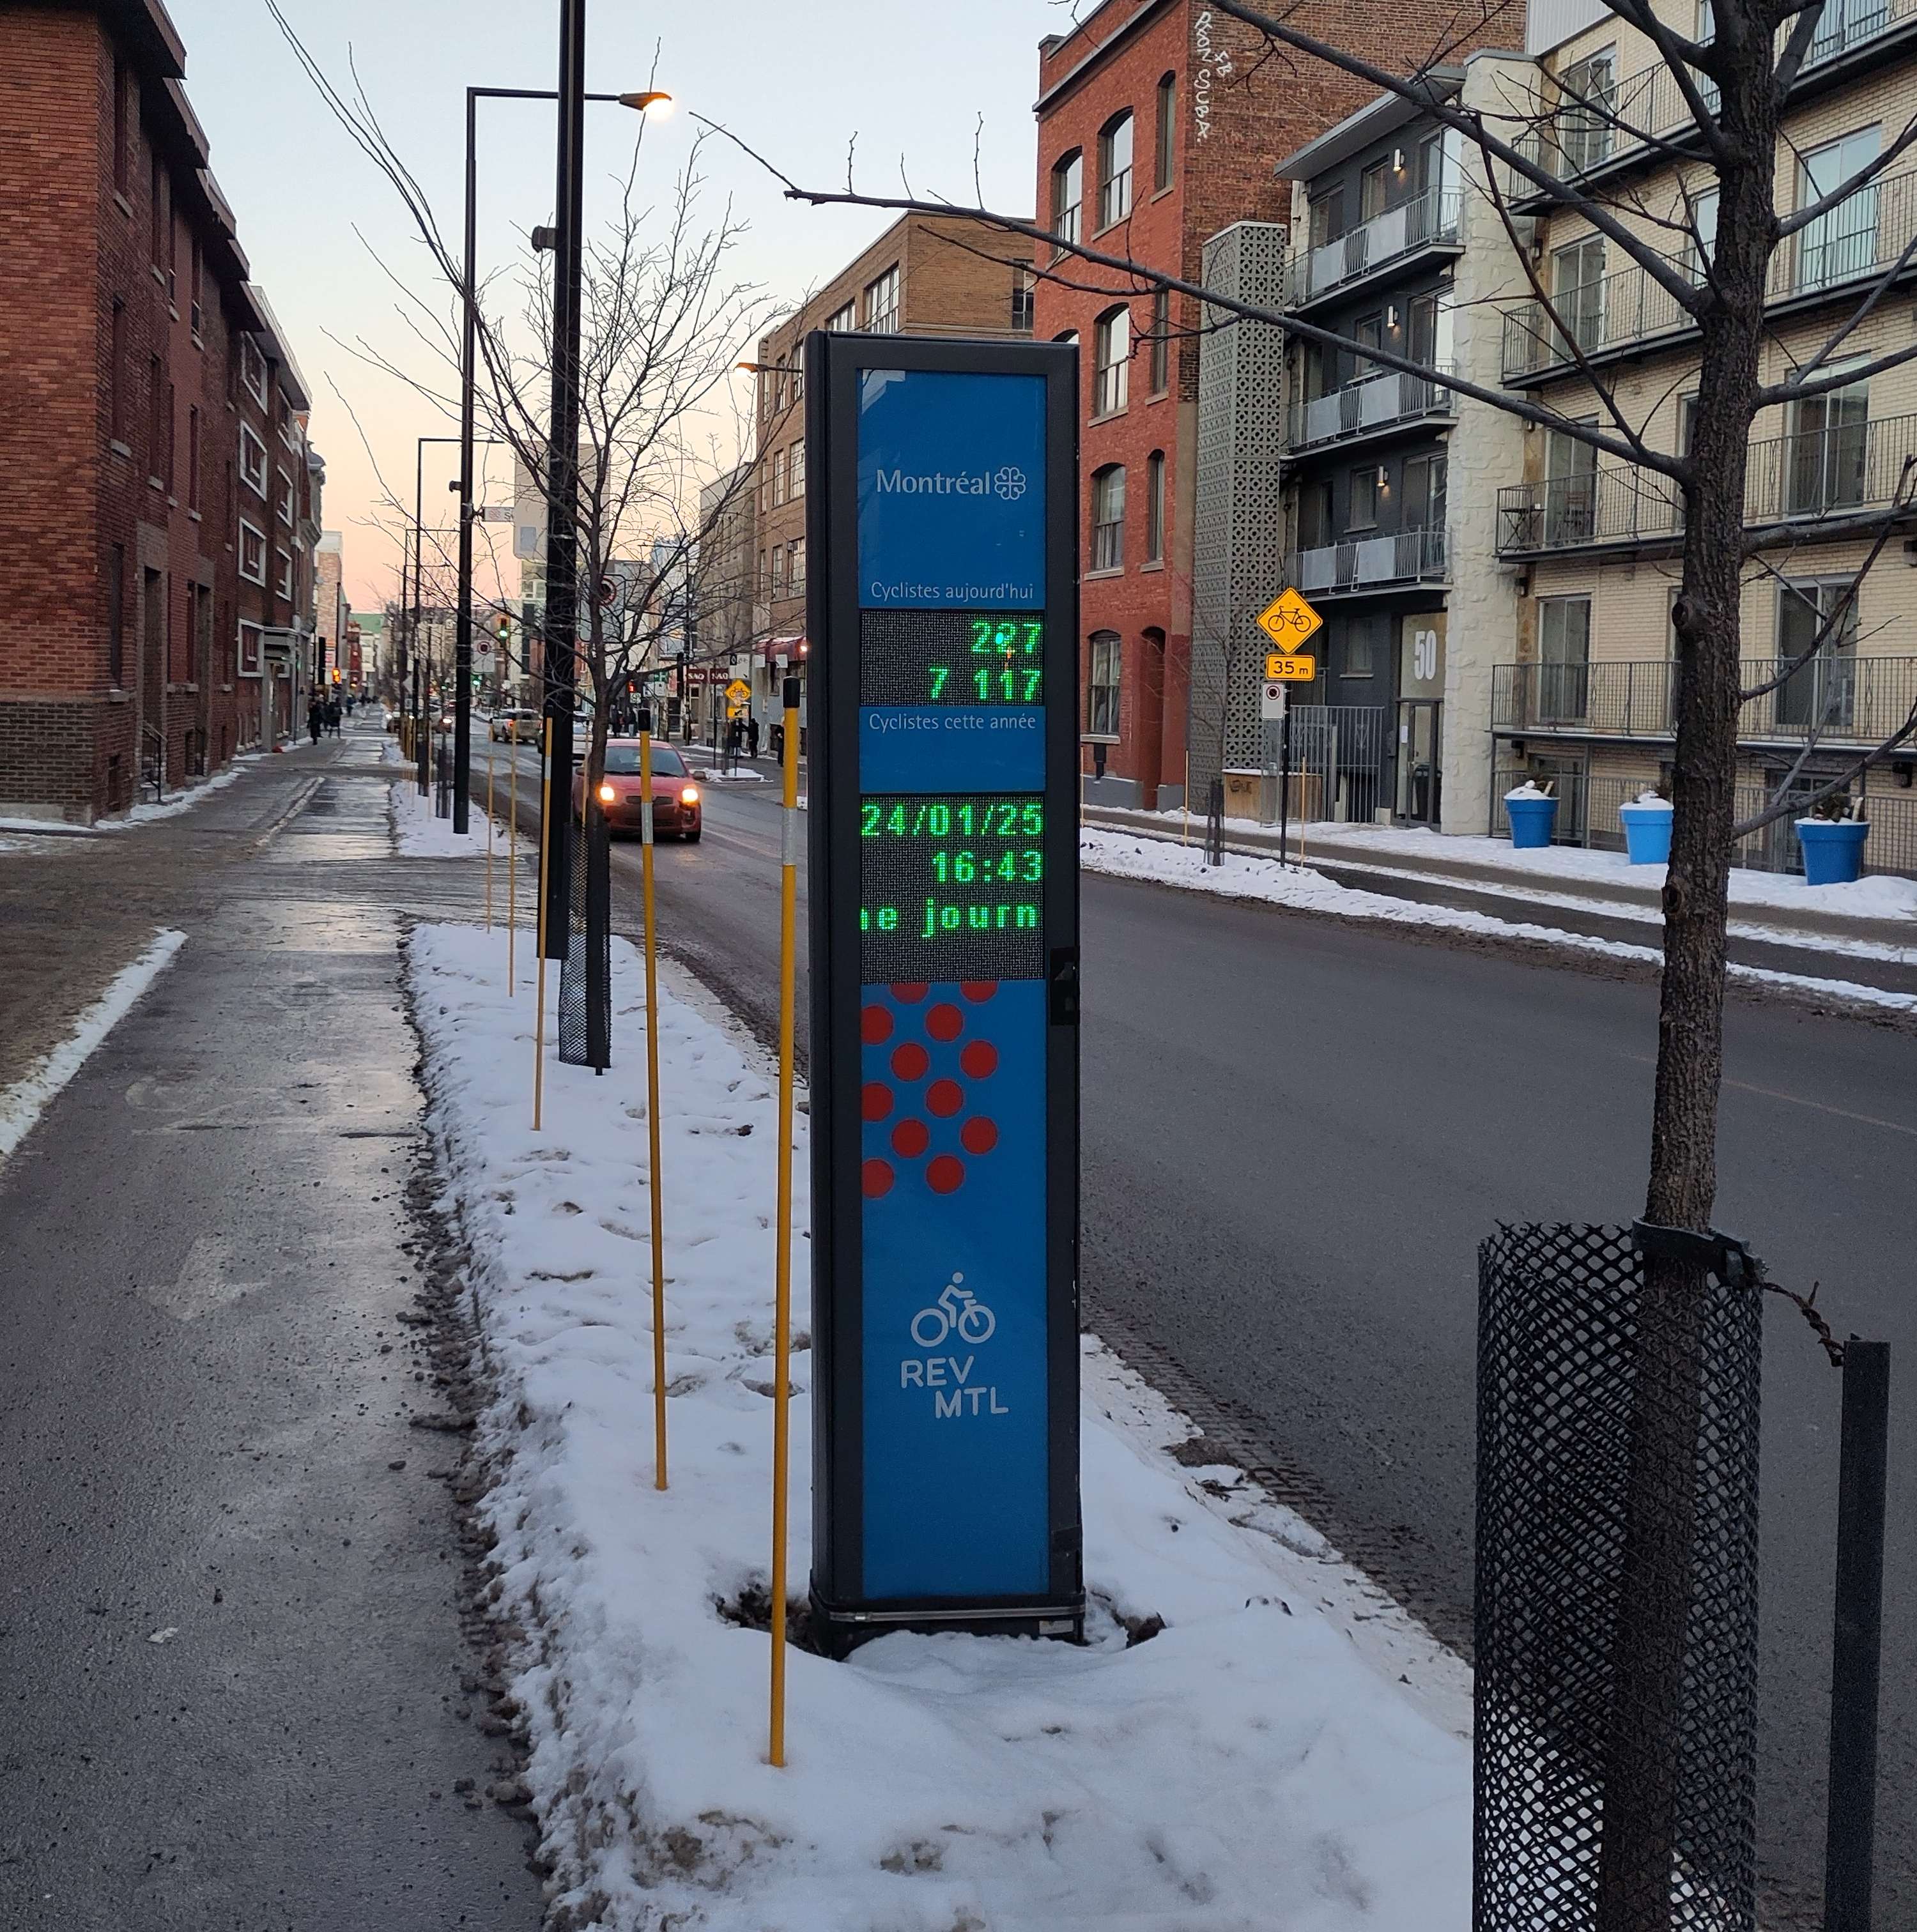
Photo by Peter McMahan

Photo via Flickr user Midnight Believer